
Wednesday, September 12, 2018

Friday, August 31, 2018
PODCAST: Tracking Tweets to Forecast Smoky Skies

Now, scientists at the U.S. Forest Service have analyzed 39,000 tweets like these from the 2015 wildfire season, and found that social media data can be a reliable way to augment existing air quality monitoring data in predicting the extent—and the public health effects—of wildfire smoke. The researchers presented the findings at a conference in Denmark earlier this month, and study author Sonya Sachdeva joins Science Friday to talk about how tweets can be a useful tool to learn about air quality and people’s perspectives on nearby wildfires.
Listen HERE.
Wednesday, August 22, 2018
Fire Weather Alert System Prototype
If you want to be notified of a specific type of weather event in your area, consider subscribing to a new service developed by the Firelab in Missoula, MT. Go to https://weather.firelab.org/fwas/ or just type "fire weather alert system" into your browser. Set your location and thresholds for weather variables in a specific radius from your location. You can also set the alert to expire in an amount of time up to seven days. For example, if you want to know if the RH drops below 22%, you can set it and wait for an alert by email or text. If you won't be in cell coverage, but still want the alert, you can ask your dispatch to configure the alert and warn you if it's activated. It's a pretty simple interface, but the developers would be interested in hearing from you if you use it!
 |
| The interface is simple, but also easy to use. |
Tuesday, August 14, 2018
Looking for IR perimeters

Wednesday, July 25, 2018
Geospatial Data Downloads from WFDSS
If you are looking to download WFDSS data, some is available and some isn't. Some data, like private home locations and infrastructure are data owned by Homeland Security. We don't have authority to download those data, only to access those data while "in" a password-protected site like WFDSS. However, some data ARE available to download. Go to the WFDSS Home Page and click "Data" in the left menu. Here you will find several links, the third of which will bring you to the downloads page with most items. Check out the other links here as well! Some datasets are huge--downloader, beware!


Monday, July 16, 2018
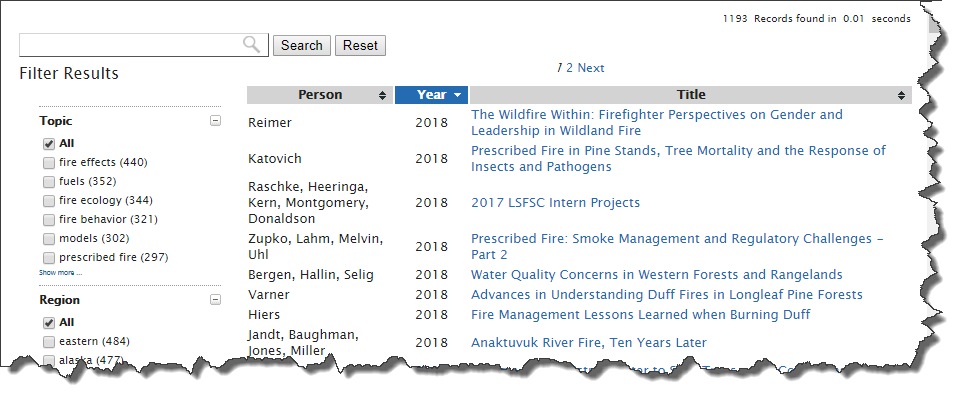
Archive of Fire Videos and Webinars is Available!

Sometimes late in the afternoon or toward the end of the week, you just need a little something to motivate yourself, learn something new, or distract yourself from a task...just for a few minutes until you can get your mind back on track. Don't get me wrong--taking a walk and getting some fresh air is good too! This archive might provide some options to take a different kind of mental break, but still allow you to feel OK about using your time to browse the web. I know it's a little nerdy, maybe, but I like browsing through sites like this just to find out things that I don't know I don't know. Check it out at https://www.frames.gov/partner-sites/presentation-archive/
Friday, July 6, 2018
Looking for Lightning Data?
As many of you know, the prior BLM lightning viewer (located at https://wfmi.nifc.gov) ceased operation last year. As a result, two temporary lightning viewer capabilities were created (EGP and a simple BLM). For those that are not aware of these current/temporary solutions, here are links to those sources:
Temporary BLM viewer:
Also available for those with a WFMI logon (https://wfmi.nifc.gov)
Temporary EGP viewer:
Login; Situation Analysis (SA); OPS; Li; Layers/BLM
Lightning
Near term:
EGP has executed a task order to create a new viewer on EGP
that is intended to address issues like performance, zooming, caching
preferences; timeouts; etc. This viewer is estimated to be be available
in August 2018. Functions described below.
We ask that users continue their patience with using the
temporary solutions until the near-term solution comes online.
Thanks, John
John Noneman
Project Manager
Bureau of Land Management
National Interagency Fire Center (OC-390)
208-387-5496
***************************************************************************
Instructions:
EGP (Enterprise Geospatial Portal) currently displays Bureau of Land Management (BLM)
lightning data in both 2D (Situation Analyst) and 3D (FireGlobe) displays. Both 2D and 3D displays include a lightning
viewstate with layers for BLM lightning data in fixed time ranges: last hour,
last 6 hours, last 12 hours, 24 hour, and 2-7 days. The
requirements for the viewer are detailed in a document that has been circulating via email, but here is some basic info:
The EGP Lightning Viewer will be an ASP.Net web
application hosted by NESS at the EROS data center as a sub-site on the EGP
domain similar to FireGlobe and Flight.
The EGP CCB will serve as the CCB for the Lightning
Viewer.
Authentication and authorization will be handled by the
EGP LDAP. All users authorized to view
Situation Analyst or FireGlobe will have access to the lightning viewer.
The 2D map display will be the default view. The default view will be the continental
United States (CONUS). The default
display of lightning data will be the previous 12 hours.
The 2D display will have the following Graphical User Interface
(GUI) elements/controls:
·
Switch to 3D View
·
Zoom in/out
·
Text display of count of lightning strikes in
current view
·
Selection of time period to display
·
Bookmarks for pre-defined geographical areas
·
Layer control to show/hide optional layers
·
Polygon draw toggle.
In addition to the GUI controls, the GUI will support
mouse click-drag for panning the map and left-click for opening meta data
popups.
The GUI elements are illustrated in Figure
2‑1. This
mockup represents one possible implementation of the required
functionality. The specific interface
elements may change during design/development based on requirements and user
feedback. The GUI and underlying code
will be based on FireGlobe which will result in the features described below
having a similar look and feel to the existing FireGlobe application including
its use of headers, footers, fly-out panels and popups.
Lightning strikes will be displayed as individual +/-
markers based on the polarity of the strike.
Individual strikes will be shown at all zoom levels. Testing will determine if there is a number
of lightning strikes above which the display does not function properly. If such a threshold exists, the view will be
configured to display an alert with a message containing the number of strikes
and a request to the user to change the view, e.g., “The current view contains
110,000 strikes which exceeds the limit of the viewer. Please zoom in to display fewer strikes for
the area of interest.”
Clicking on a lightning strike indicator will open a popup
with detail information as shown in the center of the map.
The four buttons at the top left of the map pane will provide
access to the layers menu, the bookmarks menu, toggle polygon drawing on/off,
and export data. Each icon will display
an activated state.
The table at the top right will provide a count of
lightning strikes in the current map view.
The controls at the bottom right will provide zoom, center
on user’s location, and toggle to 3D view.
The dropdown at the bottom left will provide time span
options including the previous 1, 6, 12, 24, 48 and 72 hour periods and a
“Range” option that will display inputs for start and stop time (i.e., date-time
input with minute precision).
The polygon drawing feature will allow the user to draw a
polygon around a map area. When the
polygon is closed and selected, the lightning strike counts will be updated to
display the counts within the enclosed area.
The text in the count table will use a font color corresponding to the
polygon line color to provide a visual cue that the counts represent only the
polygon area. When the polygon is
de-selected, the counts will revert to showing values for the entire map view. Polygons will use a set of pre-configured
contrasting colors (not user configurable).
Data export will create a file download of CSV data
containing time, latitude, longitude, and polarity of strikes in the current
view. Header information will be
included with the start and stop time of the time interval selected and the
name of the current bookmark if active.
The 3D map display will display the lightning data on a
globe view. The 3D GUI will contain the
same controls as the 2D viewer. The view
toggle button at the bottom right will display “2D” instead of “3D” in the 3D
view.
EGP currently processes a data feed from BLM containing
lightning strike data. However, because
of the volume of lightning data and the limited requirements for lightning
strike display in SA and FireGlobe, only seven days of data is retained on a
rolling basis. The current EGP database
optimizes query and display by preselecting strike data in the last 24 hours
and in the previous two to seven days into separate tables.
The new EGP lightning strike viewer will require access to
archived data. As part of the design
process, the database table design will be prototyped to retain efficient
processing of data with a larger data set.
In addition, the volume of necessary storage will be estimated from
historical data to provide estimates of storage requirements for the future.
The existing EGP lightning feed processor and database
stored procedures will be reused where possible for the new viewer, but the
existing EGP process and data will not be changed. The new EGP Lightning Viewer will use a new
ETL process and database tables to make the lightning viewer independent from
the current SA and FireGlobe versions.
This will allow SA and FireGlobe to retain their current lightning views
or turn them off in the future as appropriate for those applications.
A new API will be designed and implemented as part of the
lightning viewer. The API will allow the
client-side viewer to query lightning strike data based on the parameters
allowed by the GUI including start and stop time and geographic limits of the
current view.
The sections above detail features intended for an initial
version-one deliverable. On-going work
may include the following features.
These features will be discussed and prioritized after the initial
development, testing and deployment is complete. The features below are not included in the
scope described in Section 4.0.
The initial development will include CSV data format
export. Users may desire the export of spatial
data files (i.e., geo-database or GeoPDF).
After the initial API development, the possibility of providing these
exports for user-selected time ranges and geographic areas will be
investigated.
Initial discussions of functionality included the
possibility of having start/stop times set using a graphical slider
control. There are several challenges
with using a slider control for start/stop time including:
·
Sufficient time granularity over a large archive
data set. Users will likely require
one-hour or less granularity when exploring recent data, but will want to
access archive data as well. If a
screen-width slider represents just two years of time span, an hour would be
approximately 1/10th of a pixel on typical monitors, making it
impossible for the user to perform accurate selections. A slider control may be most useful for
viewing a fixed time range in an animated fashion (e.g., display always shows 6
hours and the slider changes the base time) allowing the user to quickly
explore the archive for large-scale lightning events. However, this use would be secondary to being
able to accurately set the start/stop times of interest. After the initial viewer has been deployed,
discussion and prototyping of slider controls can be done based on lessons
learned from users and performance of the initial version.
·
The data volume of the archive data may preclude
the use of slider controls and fast-changing animations over long time
periods. Typical time periods may
contain only tens of thousands of lightning strikes per day, but events with
millions of strikes per day must be accommodated. The initial version of the lightning viewer
will allow the developers to accurately assess the archive data size and the
data loading requirements of a viewer providing animation of long time periods.
·
Display limitations of a browser-based viewer
may limit the number of data points that can be displayed with reasonable
performance. The implementation of a
viewer threshold is discussed above in Section 2.2. The effect of these limitations on the
implementation of a slider will be assessed.
Users have requested that the lightning viewer display
newly-added strikes in an animated fashion in near-real-time as the data points
are loaded from the feed. Once the basic
feed processing and display functionality is in place, the API and rendering
requirements for continually updating the display with newly-acquired data will
be assessed and tested.
The current lightning viewer in SA and FireGlobe uses
lightning strike density representations at zoom levels where the number and
resolution of individual strikes is not practical. If using a heat-map style representation of
strike density solves some of the performance issues mentioned in Section 4.2,
they will be discussed with users and prototyped as part of the on-going
development.
Monday, February 12, 2018
Agency Administrator Annual Fire Decision-Making Refresher webinar
* Update 2/27/18, 1600hrs: We just checked and are able to access the Registration from the USFS network on both Chrome and Internet Explorer. If you are still having issues, please call the number on the announcement, thanks!
*Update 2/27/18: It has come to our attention that the Registration link has not been accessible from the USFS network since 2/22/18. The link is not broken; you can access it and Register using your government email if you are OFF the network (any internet connection that is not on VPN). You can forward the link to your personal email as long as you also copy the email to your government email account to comply with policy. We apologize for this inconvenience--we are troubleshooting this problem with the CIO USFS HelpDesk. We've tested the GoToWebinar interface and you will be able to join the meeting from your government computer using the link in your government email on the USFS network. This issue does not affect DOI users.
Please join us on March 14, 10-11MDT for a refresher webinar that will cover fire decision-making. The session will be recorded and can be counted as one hour toward the recommended two-hour annual refresher for line officers. The attached flyer is just a poster, so use this link to register unless you received the flyer via email (in which it does have a 'live' link):
https://register.gotowebinar.com/register/2709423538898381315

*Update 2/27/18: It has come to our attention that the Registration link has not been accessible from the USFS network since 2/22/18. The link is not broken; you can access it and Register using your government email if you are OFF the network (any internet connection that is not on VPN). You can forward the link to your personal email as long as you also copy the email to your government email account to comply with policy. We apologize for this inconvenience--we are troubleshooting this problem with the CIO USFS HelpDesk. We've tested the GoToWebinar interface and you will be able to join the meeting from your government computer using the link in your government email on the USFS network. This issue does not affect DOI users.
Please join us on March 14, 10-11MDT for a refresher webinar that will cover fire decision-making. The session will be recorded and can be counted as one hour toward the recommended two-hour annual refresher for line officers. The attached flyer is just a poster, so use this link to register unless you received the flyer via email (in which it does have a 'live' link):

Monday, November 6, 2017
Check out the Fire Library
Have you heard about the Fire Library?
The Wildland Fire Library is a collection of long-term assessments, fire progressions, fire behavior reports, and other documents and resources to support fire modeling and assessment of long-duration fires. Each file is tied to some event with a location, a start date, and background information.
Event locations, file attachments, and remarks are optional, but because events can represent many things, every event needs one tag to indicate document type:
Progression Fire Progressions
WindWizard WindWizard Library (KMLs)
FireWeather Critical Fire Weather
LTA Long-term Assessments
SeasonEnd Season-ending Analyses
SPP Structure Protection Plans
FireDanger Fire Danger & PocketCards
Report Reports, Reviews, & Case Studies
Burnover Fatalities or Entrapments (Burnovers)
Note Fire Modeling & LCP Calibration Notes
The main map shows all events by tag-derived category. You can also browse the full list and, if something is missing, login to add your own document.
This site is operated by Rick Stratton and Jim Edmonds at USFS Pacific NW and Alaska Regions and BLM OR/WA State Office.
https://firelibrary.org/
Tuesday, October 31, 2017
Webinar - Interagency Coordination to Meet Multiple Objectives: An Effective Approach to Wildfire
Nov 1, 2017 12:00 pm - 1:00 pm
Mountain Time
Sponsored by the Southwest Fire Science Consortium
Presented by Shaula Hedwall, U.S. Fish & Wildlife Service and Wesley Hall, Coconino National Forest
While the number of acres burned annually by uncharacteristic wildfire continues to grow, it is becoming exceedingly important for agencies to identify opportunities to use wildfire to meet multiple land management and resource objectives. When conditions allow for unplanned ignitions to be managed for one or more of these objectives, it may be appropriate to use wildfire during the peak of the traditional fire season. Management response to wildland fire on federal lands is based on objectives established in the applicable Land/Resource Management Plan and/or Fire Management Plan. Objectives are affected by changes in fuels, weather, topography; varying social understanding and tolerance; and involvement of other governmental jurisdictions having different missions and objectives. Coordination with resource specialists and development of mutually agreed to objectives is fundamental to being successful in achieving land and resource objectives with wildfire. We will discuss recommendations for implementing this process using case studies incorporating Mexican spotted owl management objectives into wildfire management and post-fire monitoring.
To register, click HERE.
Original Announcement is here:
https://www.frames.gov/about/calendar/webinar-interagency-coordination-meet-multiple-objectives-effective-approach-wildfire/?eID=6376
Subscribe to:
Posts (Atom)